1 Semimetal types
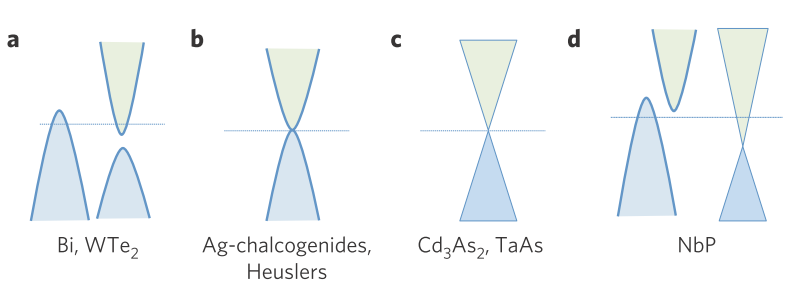
Fig. 1Schematic illustration of different types of semimetals and representative materials. a, Normal semimetal with the coexistence of electron and hole pockets. b, Semimetal with quadratic conduction and valence bands touching at the same momentum point. c, Weyl semimetal and Dirac semimetal. d, Semimetal with one hole pocket from the normal quadratic band and one electron pocket from the linear Weyl semimetal band for NbP. The valence and conduction bands are indicated by blue and green shading, respectively. The Fermi energy is marked in each case by a horizontal line.[1]
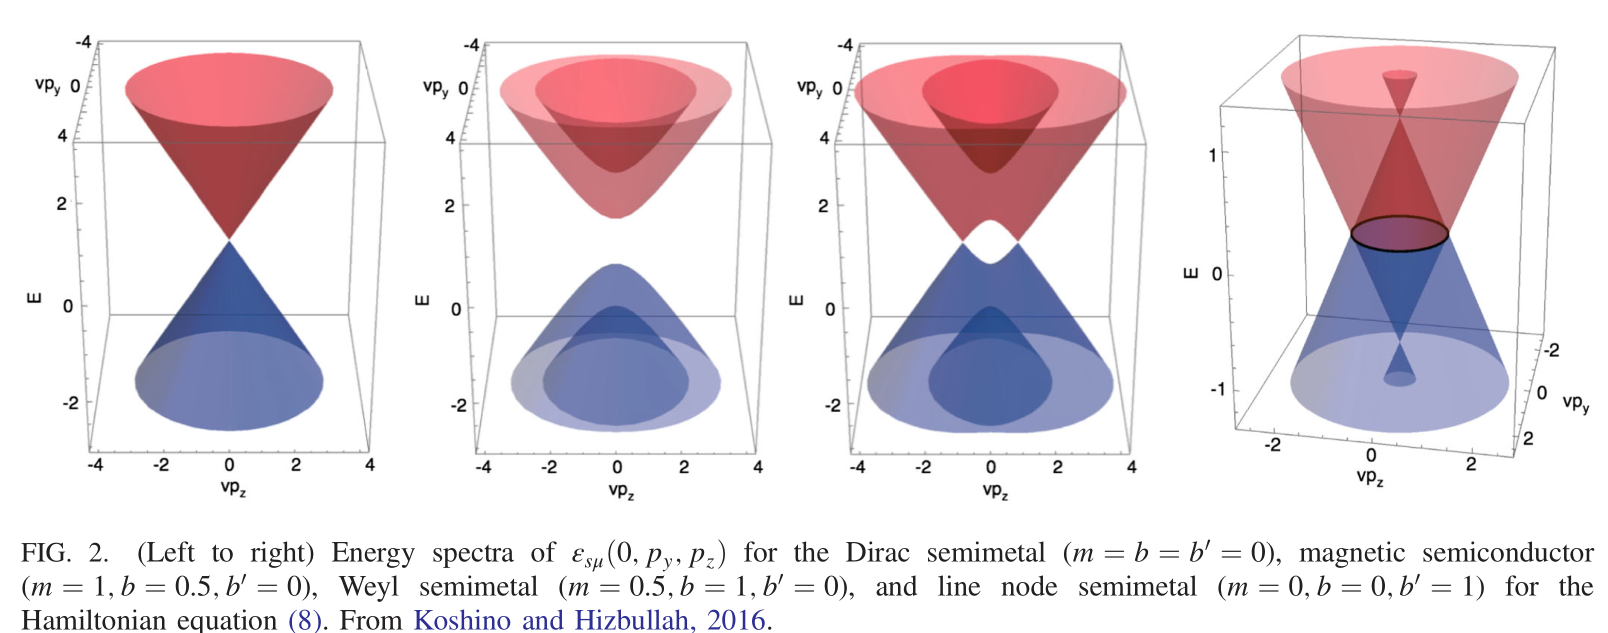
- Dirac Semimetal
- Weyl Semimetal: Breaking time reversal symmetry/Breaking space inversion symmetry
- Node-line semimetal: Time reversal and space inversion symmetry, Mirror symmetry
1.1 Weyl Semital[2]
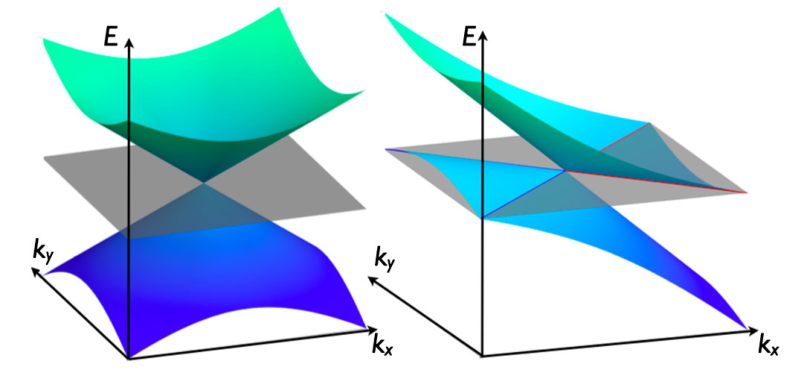
Fig. 2. (Left) Conventional type I Weyl point with pointlike Fermi surface. (Right) Type II Weyl point is the touching point between electron and hole pockets. Red and blue (highlighted) isoenergy contours denote the Fermi surface coming from electron and hole pockets with chemical potential tuned to the touching point.
2 Rashba Model
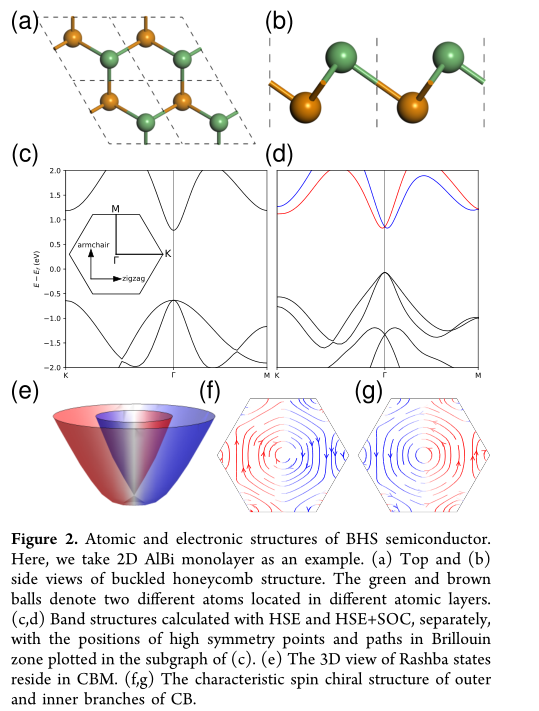
3 Fermi velocity
3.1 Unit Conversion
- Usually the realtion between lattice vector a_{i} and reciprocal lattice vector b_{j} is esspresed as a_{i}*b_{j}=2{\pi}{\Delta}_{ij}, however it is esspresed as a_{i}*b_{j}={\Delta}_{ij} in VASP,so the unit of reciprocal lattice vectors in VASP is 2\pi. If you use reciprocal lattice vectors from vasp, please multiply reciprocal lattice vectors with 2\pi.
- Formula for Fermi velocity:E={\hbar}kv_F{\Rightarrow}v_F=\frac{1}{\hbar}\frac{dE}{dk},so v_F=\frac{1}{\hbar}\frac{dE}{dk} =\frac{dE}{dk}\times1.602\times10^{-19}\times10^{-10}/(1.054571817\times10^{-34})=\frac{dE}{dk}\times1.5191\times10^5 m/s.
3.2 Calculation
- Optimization Cell and positions
- Band structure calculation to determine Dirac point (e.g., 0.33333 0.33333 0), where E_{VB}-E_{CB}{\sim}0.
- Non-SCF calculation with very dense K-points near the Dirac point, to get VB and CB energy surfaces.
- Use some script to generate files (e.g., eig_bandsurf_004.dat) for the
energy surfaceofeach bandat every K points,
$ head eig_bandsurf_004.dat
Kx             Ky             Kz             Energy  Kx*Rec         Ky*Rec         Kz*Rec
0.30333300     0.30333000     0.00000000     -0.90880000    0.77226277     1.33758928     0.00000000
0.30583300     0.30333000     0.00000000     -0.86824900    0.77862758     1.34126400     0.00000000
0.30833300     0.30333000     0.00000000     -0.82815100    0.78499239     1.34493872     0.00000000
0.31083300     0.30333000     0.00000000     -0.78858300    0.79135720     1.34861345     0.00000000
...
where Kx/Ky/Kz are K points near Dirac point,Kx*Rec/Ky*Rec/Kz*Rec are K points multiplied by the reciprocal lattice vecctors (similar to the conversion from Direct coordinates to Cartesian coordinates), and Energy is the energy for this band at Kx/Ky/Kz.
5. Extract K lines across Dirac point along x/y direction.
awk '($1 ~ /0.33333/ && $2 < 0.33333)' eig_bandsurf_004.dat > Dirac_ky.dat
awk '($2 ~ /0.33333/ && $1 < 0.33333)' eig_bandsurf_004.dat > Dirac_kx.dat
awk '($1 ~ /0.33333/ && $2 > 0.33333)' eig_bandsurf_005.dat > Dirac_ky2.dat
awk '($2 ~ /0.33333/ && $1 > 0.33333)' eig_bandsurf_005.dat > Dirac_kx2.dat
6. Only K points near Dirac point satisfy linear realtionship, so some K point far from Dirac point should be deleted. Take kx direction for example, to plot y=col(4) vs. x=col(5) in Dirac_kx.dat, to delte K point far from Dirac point and keep some near K points which satisfy linear realtionship. Linear Fitting (y=col(4) vs. x=col(5)) using remaining K points to get the slope along kx direction (or y=col(4) vs. x=col(6) for ky in Dirac_ky.dat ), \frac{dE}{dk_x}=6.337, \frac{dE}{dk_y}=5.485 eV \AA, as a result, v_F for graphene is 9.62\times10^5/8.33\times10^5 m/s along x/y direction.
7. Energy surfaces near Dirac point could be plotted by Gnuplot using files like eig_bandsurf_004.dat.